By the time leadership sees the problem, the money is already gone.
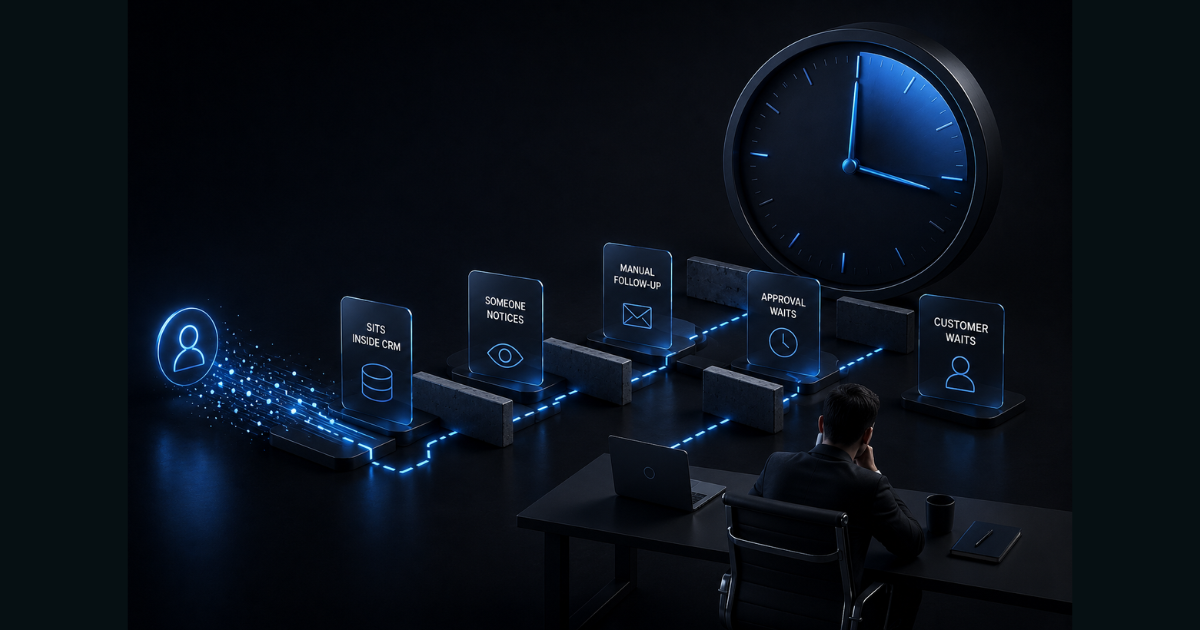
The customer has left. The stock has run out. The contract auto-renewed on unfavourable terms. The SLA breach has become a credit note. Leadership learns about it in the monthly review - and spends the next hour discussing something that can no longer be changed.
Here is the uncomfortable part. The warning signs were almost always present. They sat in different systems, owned by different teams, and no one connected them in time.
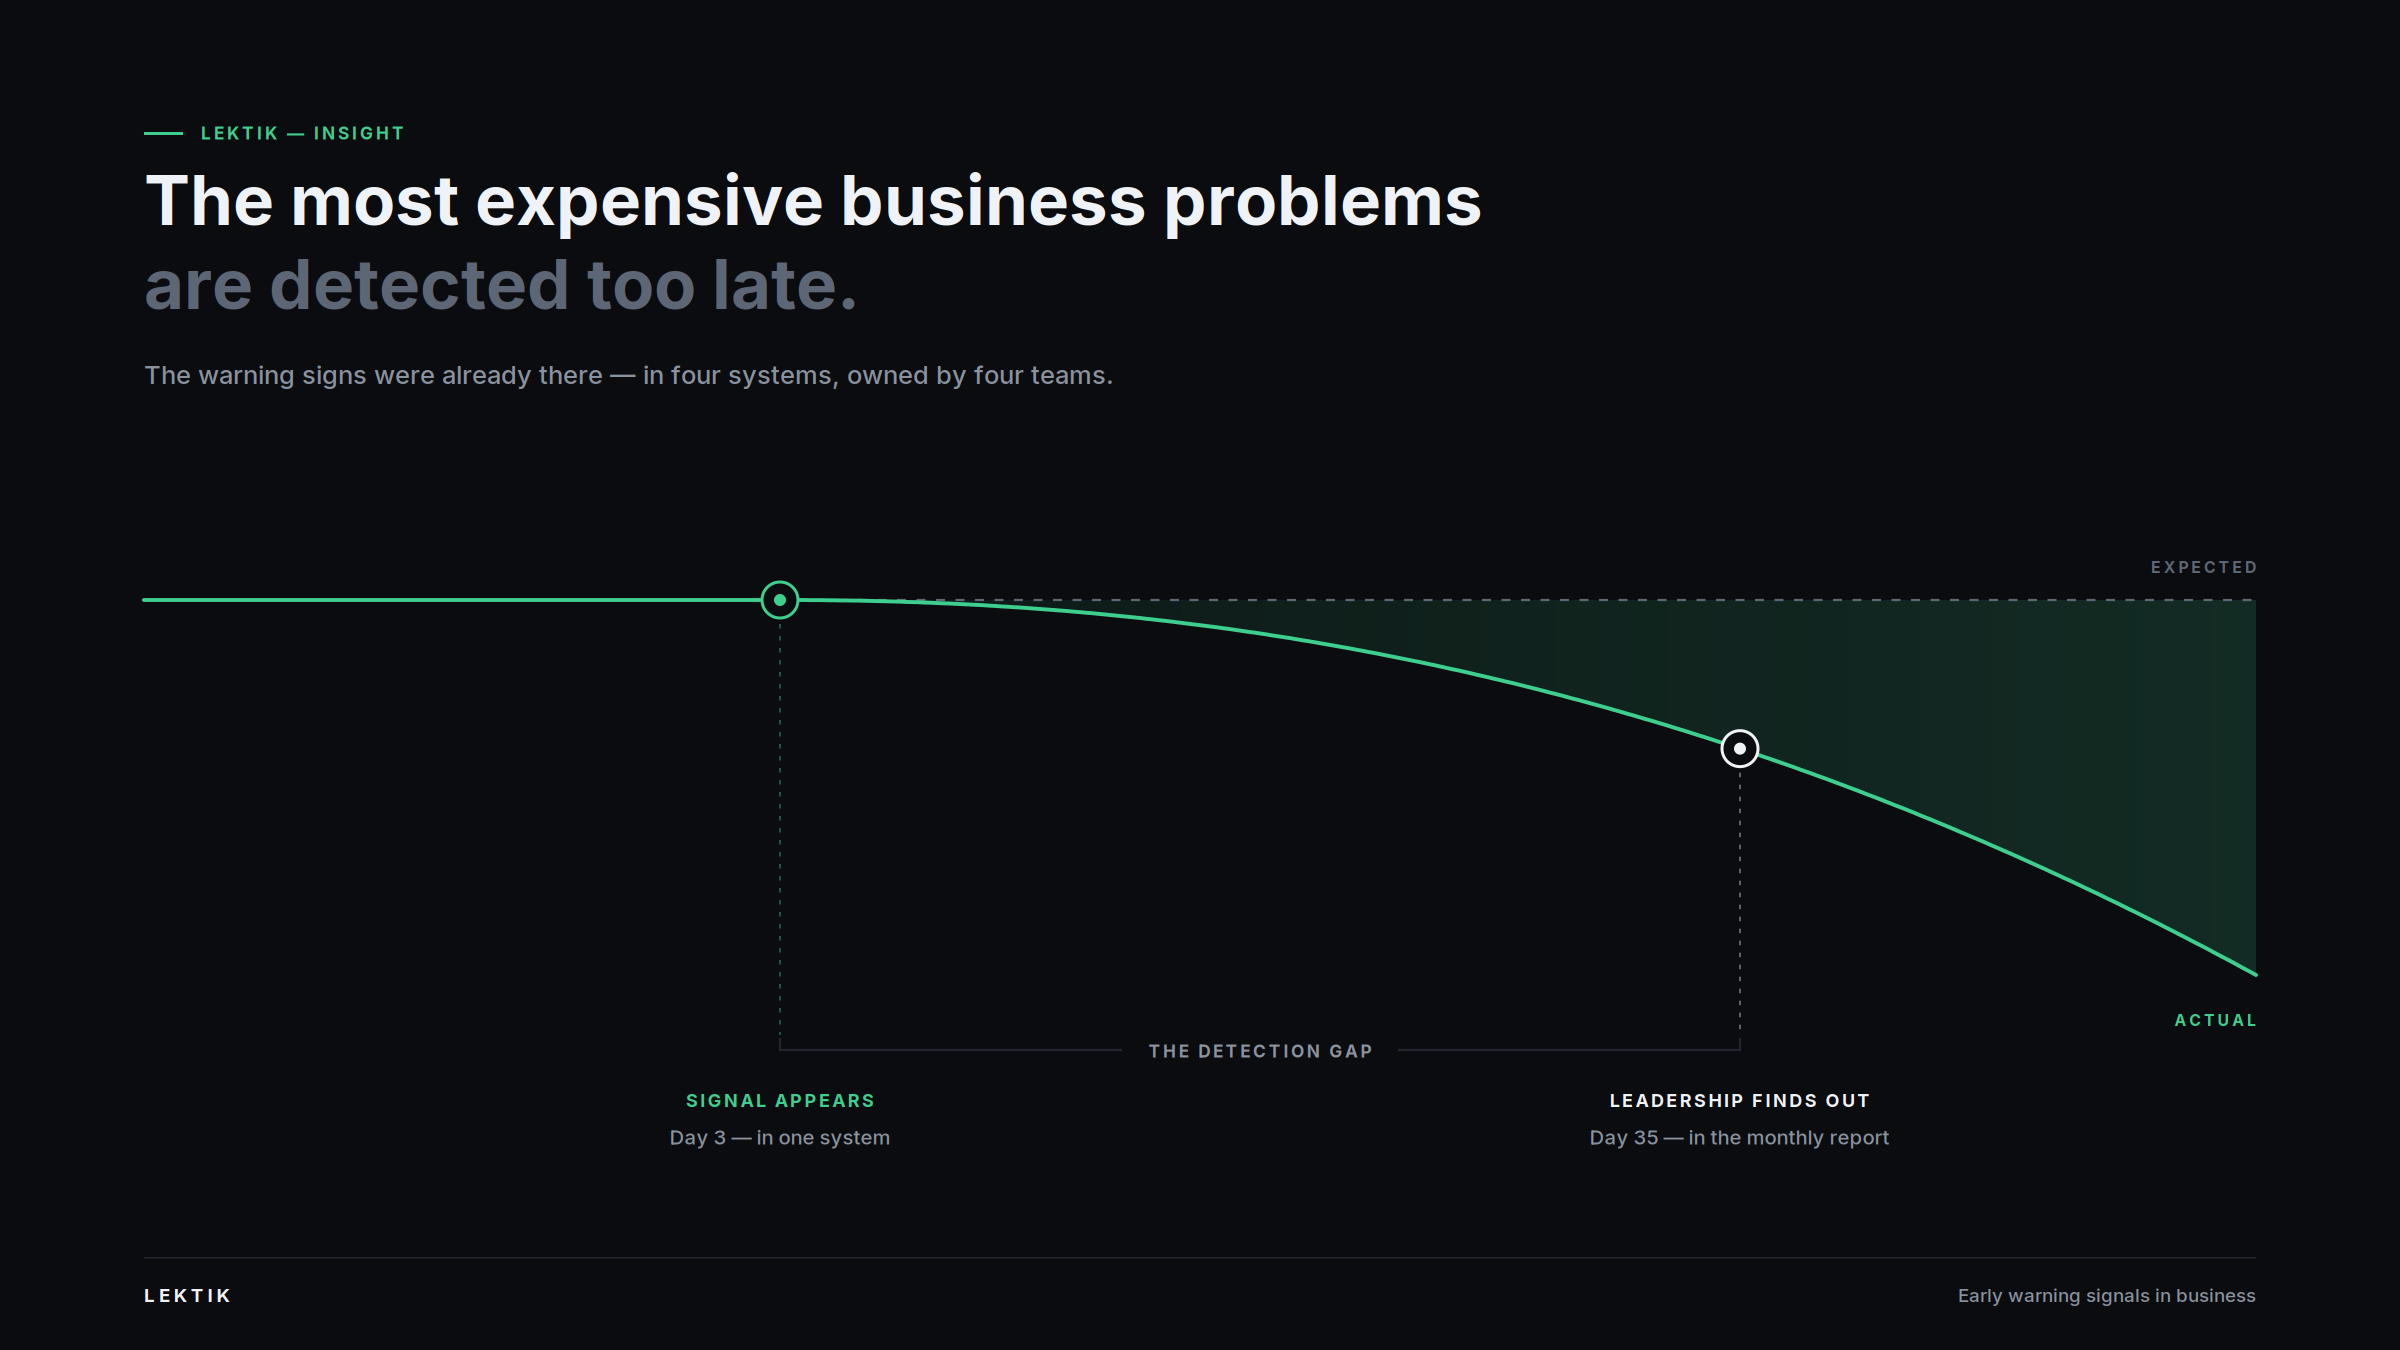
That gap - between when a signal appears and when leadership acts - is where most avoidable losses live. Early warning signals in business are rarely missing. They are scattered.
Executive Summary
The problem this article addresses Companies detect their most expensive problems after the cost is locked in, despite already holding the data that predicted them.
Why it matters Reactive management pays twice - once for the loss, once for the emergency response. Early intervention usually costs a conversation.
What you will learn
- ✓ Why monthly reporting structurally guarantees late detection
- ✓ How fragmented data delays not just discovery, but agreement to act
- ✓ Why dashboards fail as a prevention tool
- ✓ The six signal categories that precede most expensive failures
- ✓ A practical method for identifying your own critical signals
- ✓ The operating model proactive organisations run on
Why Reports Discover Problems Too Late
A monthly report is a verdict. It tells you what already happened, in a format designed for explanation rather than intervention.
This is a reporting cycle problem, not a reporting quality problem. Better numbers arriving on the same schedule change nothing.
- The lag is structural. A problem that begins on day 3 surfaces on day 35.
- Aggregation hides the signal. One collapsing account inside a growing region disappears into the average.
- The metric arrives after the decision window closes. Churn appears at renewal. Renewal was decided months earlier.
- Explaining a number is not the same as changing it. Most review time goes to justification, not action.
Executive Insight
Reports explain losses. Early warning systems prevent them.
What is the difference between leading and lagging indicators in business?
Lagging indicators measure results that have already occurred - revenue, churn rate, margin, on-time delivery. Leading indicators measure the behaviours and conditions that produce those results - declining product usage, slipping supplier lead times, rising support escalations, delayed approvals.
Lagging indicators tell you how you performed. Leading indicators tell you what is about to happen while you can still influence it. Most companies measure lagging indicators well and leading indicators poorly, which is precisely why problems are detected after the cost is locked in.
In practice - Manufacturing A plant reviews scrap rate monthly. Scrap is a lagging indicator. Machine cycle-time variance, which climbs two to three weeks before scrap does, is the leading indicator. Both are already being recorded. Only one is being watched.
The Fragmentation Problem: Why Your Data Already Knows
Ask a leadership team whether they have enough data and the answer is yes. Ask whether they can see a risk forming across customers, suppliers, contracts and operations simultaneously - the answer changes.
The signals behind a single expensive failure typically live in four or five places:
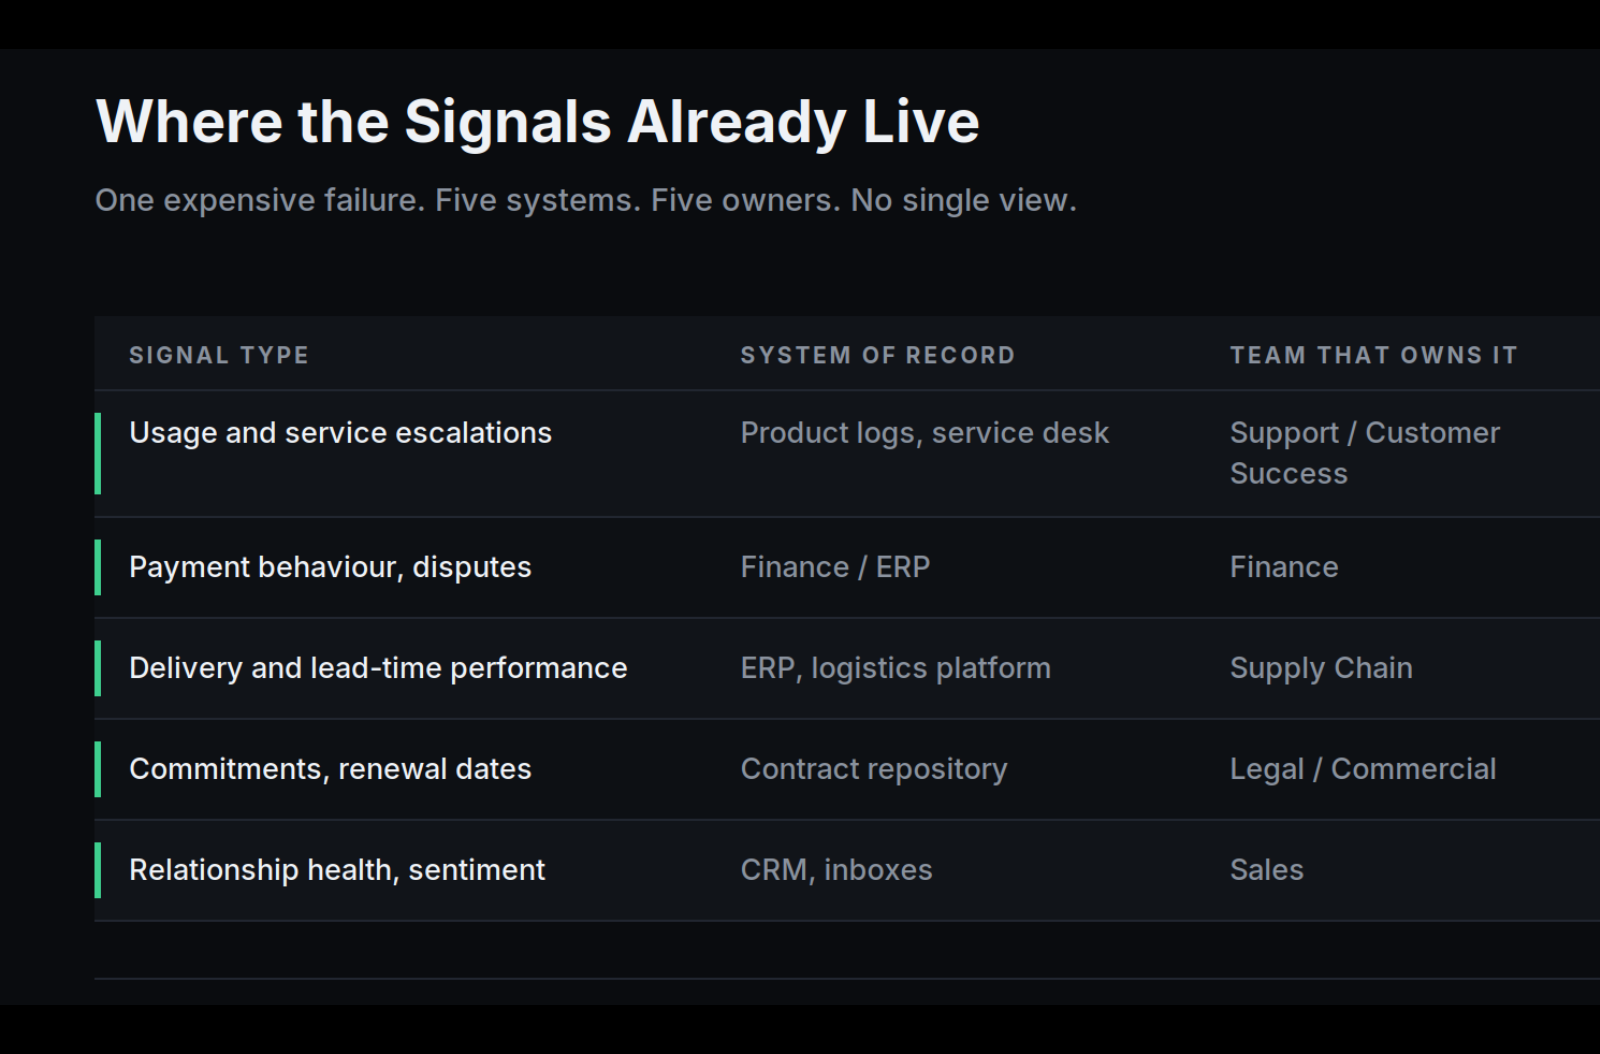
Each team sees its fragment and reasonably concludes nothing is wrong. Support sees a few extra tickets. Finance sees one late payment. Procurement sees a supplier slip four days.
Individually, noise. Together, a churn event with a delivery failure underneath it.
Fragmentation delays more than detection. It delays agreement. Before anyone acts, someone must assemble the picture, prove it, and convince a second team it is real. That reconciliation cycle often runs longer than the window in which the problem could have been fixed cheaply.
Executive Insight
Fragmented data is rarely a technology problem. It is a decision-making problem.
In practice, a logistics carrier's acknowledgement times lengthen. Procurement notices. Two weeks later, three enterprise customers miss delivery windows carrying penalty clauses. The two facts were never connected until the credit notes arrived.
Leadership Question
If a major account began churning today, how many days would pass before your executive team knew, and how many people would need to agree before anyone acted?
Why Another Dashboard Won't Solve This
Most organisations respond to this problem with a new dashboard. It rarely helps, because a dashboard is a passive surface. It waits to be visited, by someone who already suspects something is wrong.
A dashboard answers questions you thought to ask. An early warning system tells you what you should be asking about.
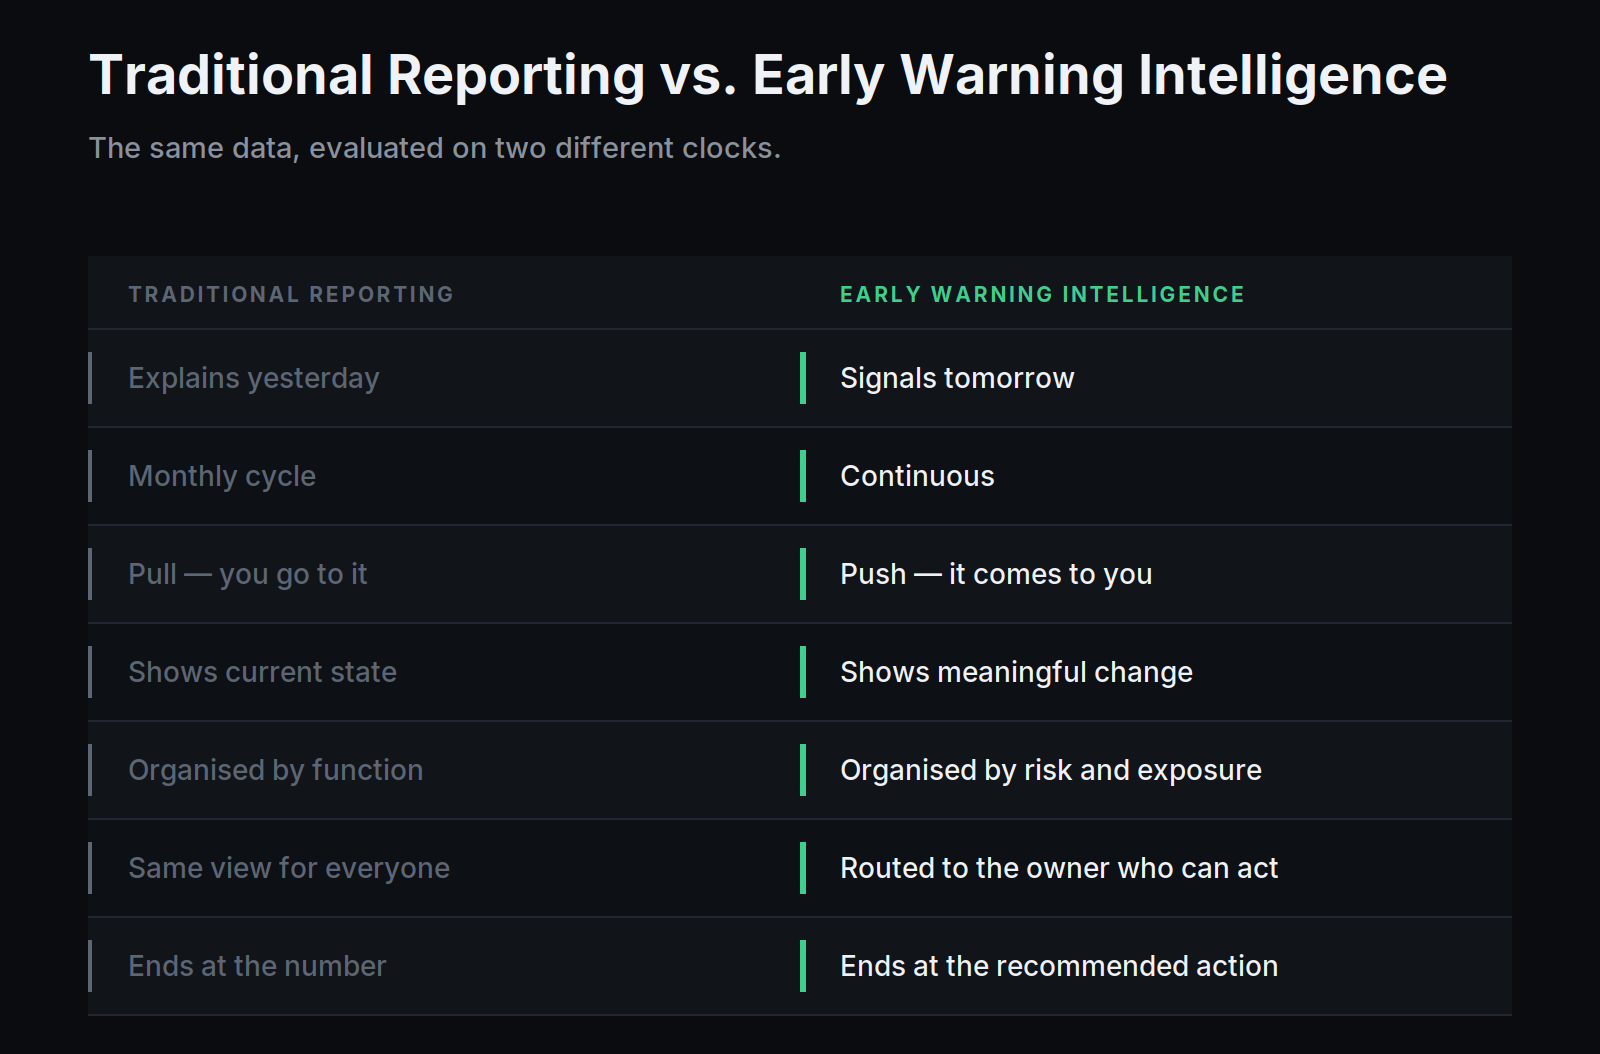
The test: if nobody opens the dashboard for a week, does anything break? If yes, you do not have a monitoring system. You have a reporting habit dependent on human vigilance.
Why do business dashboards fail to prevent problems?
Dashboards fail as a prevention tool because they are passive, siloed, and aggregated. They require someone to log in, know which view to open, and already suspect a problem exists.
They typically display data from one function at a time, so cross-functional risks, like a supplier delay that becomes a customer SLA breach, never appear in a single view. And because dashboards show totals, a serious problem inside one account, region, or product line is often averaged away.
Prevention requires detection that is continuous, cross-system, and routed to a named owner, not a screen that waits to be visited.
The Signals That Precede Expensive Failures
Every business has a small set of signals that reliably precede costly outcomes. They are usually unglamorous, and almost always already being captured.
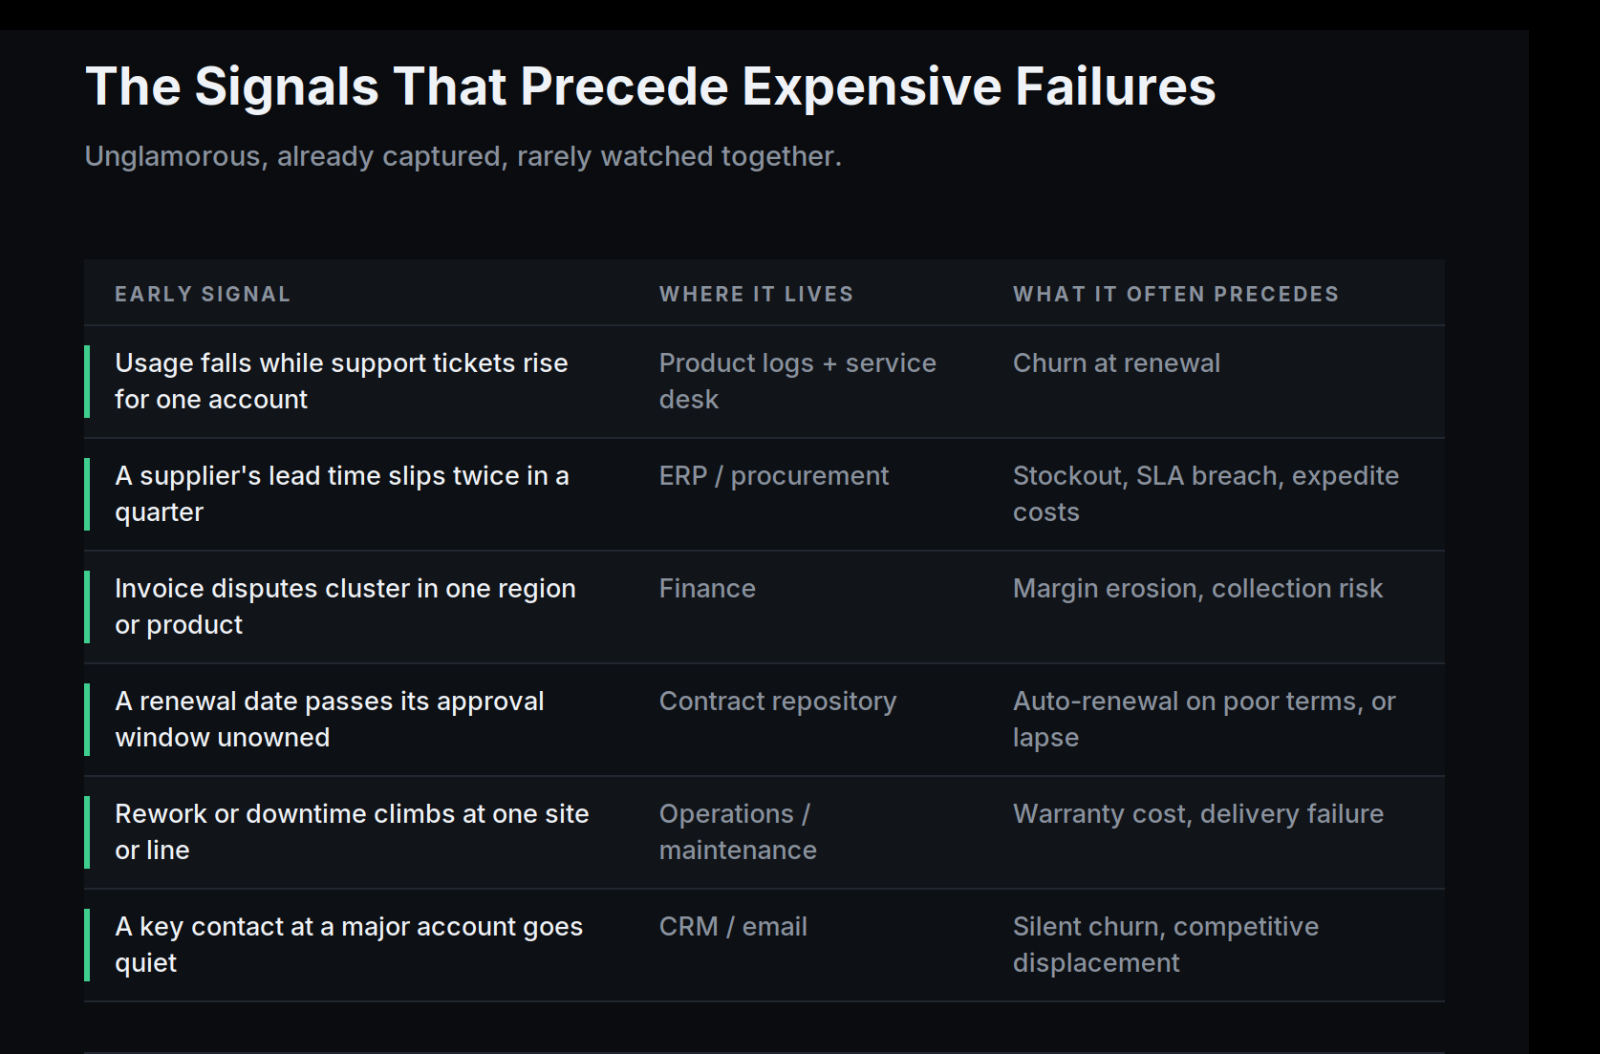
In practice - SaaS Weekly active users at a seven-figure account decline 30% across two weeks while ticket volume rises. Neither number alone triggers review. Together, they predict a renewal loss roughly four months before the renewal conversation begins.
In practice, financial services document turnaround times in one branch lengthen quietly. Three months later the same branch appears in an audit exception report. The operational signal preceded the compliance finding by a full quarter.
How to Identify the Signals That Matter to Your Business
Do not start with the data. Start with the losses.
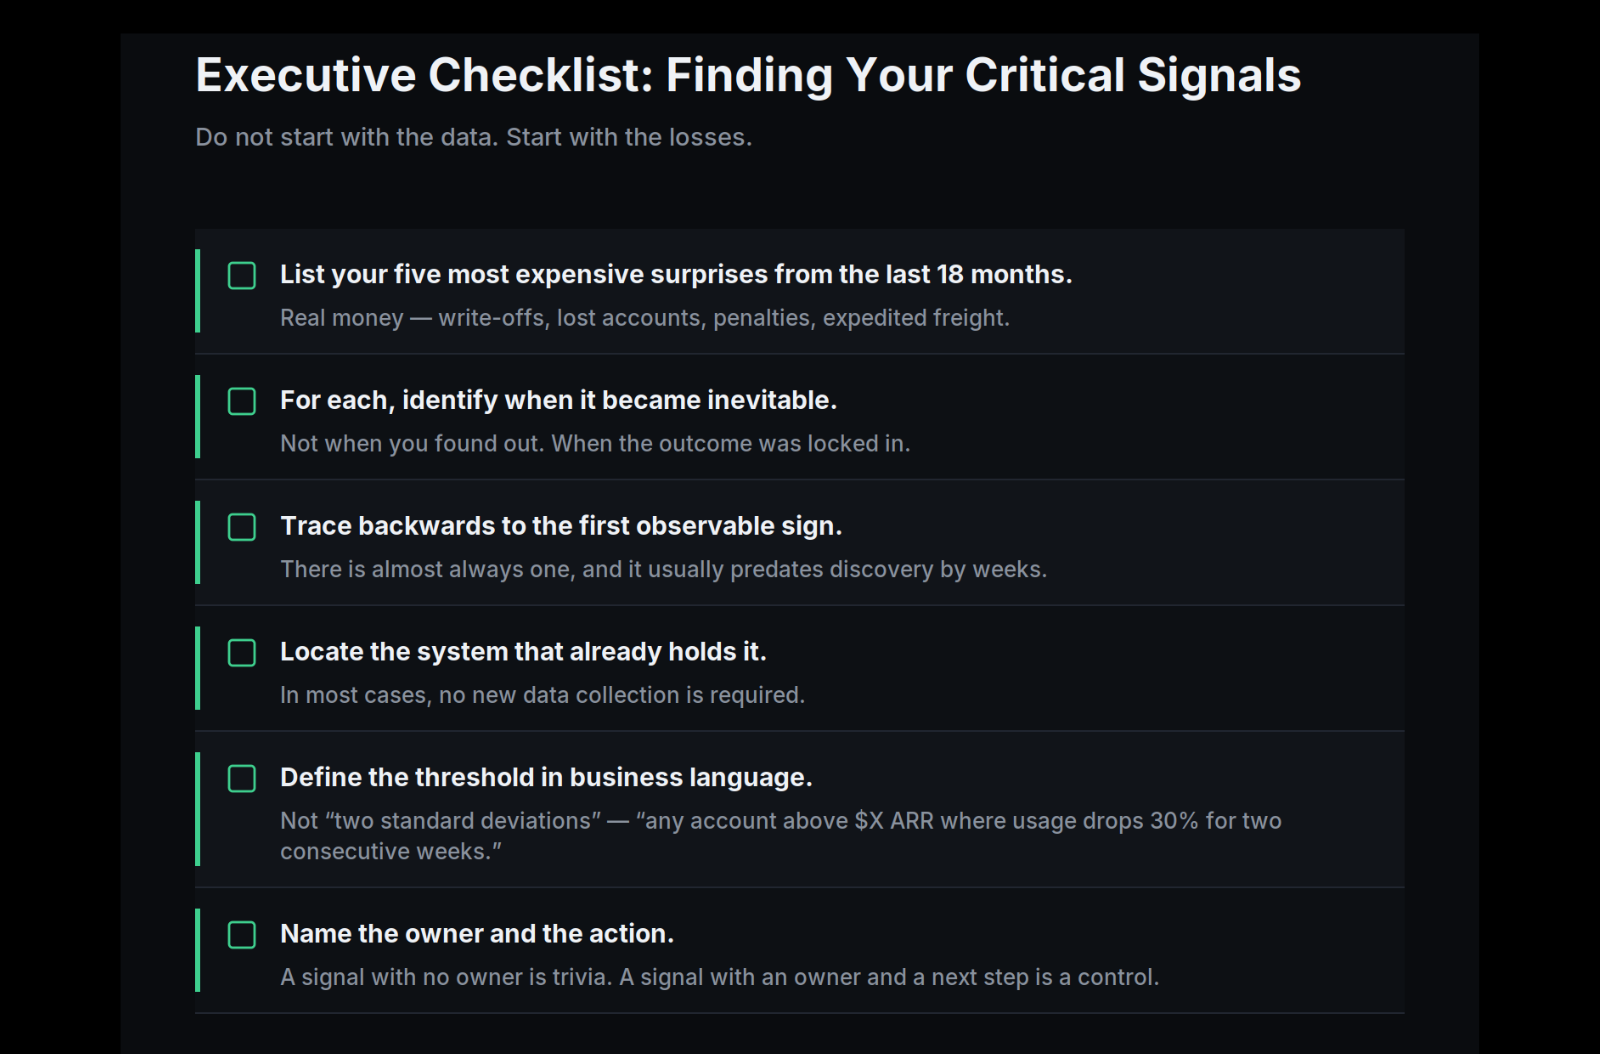
Six signals monitored seriously will outperform sixty tracked casually. Monitoring capacity, not data availability, is the binding constraint.
The Operating Model Behind Proactive Organizations
Reactive management is expensive because it pays for the problem and the response. Proactive intervention costs a conversation.
The shift runs on a six-stage operating loop:
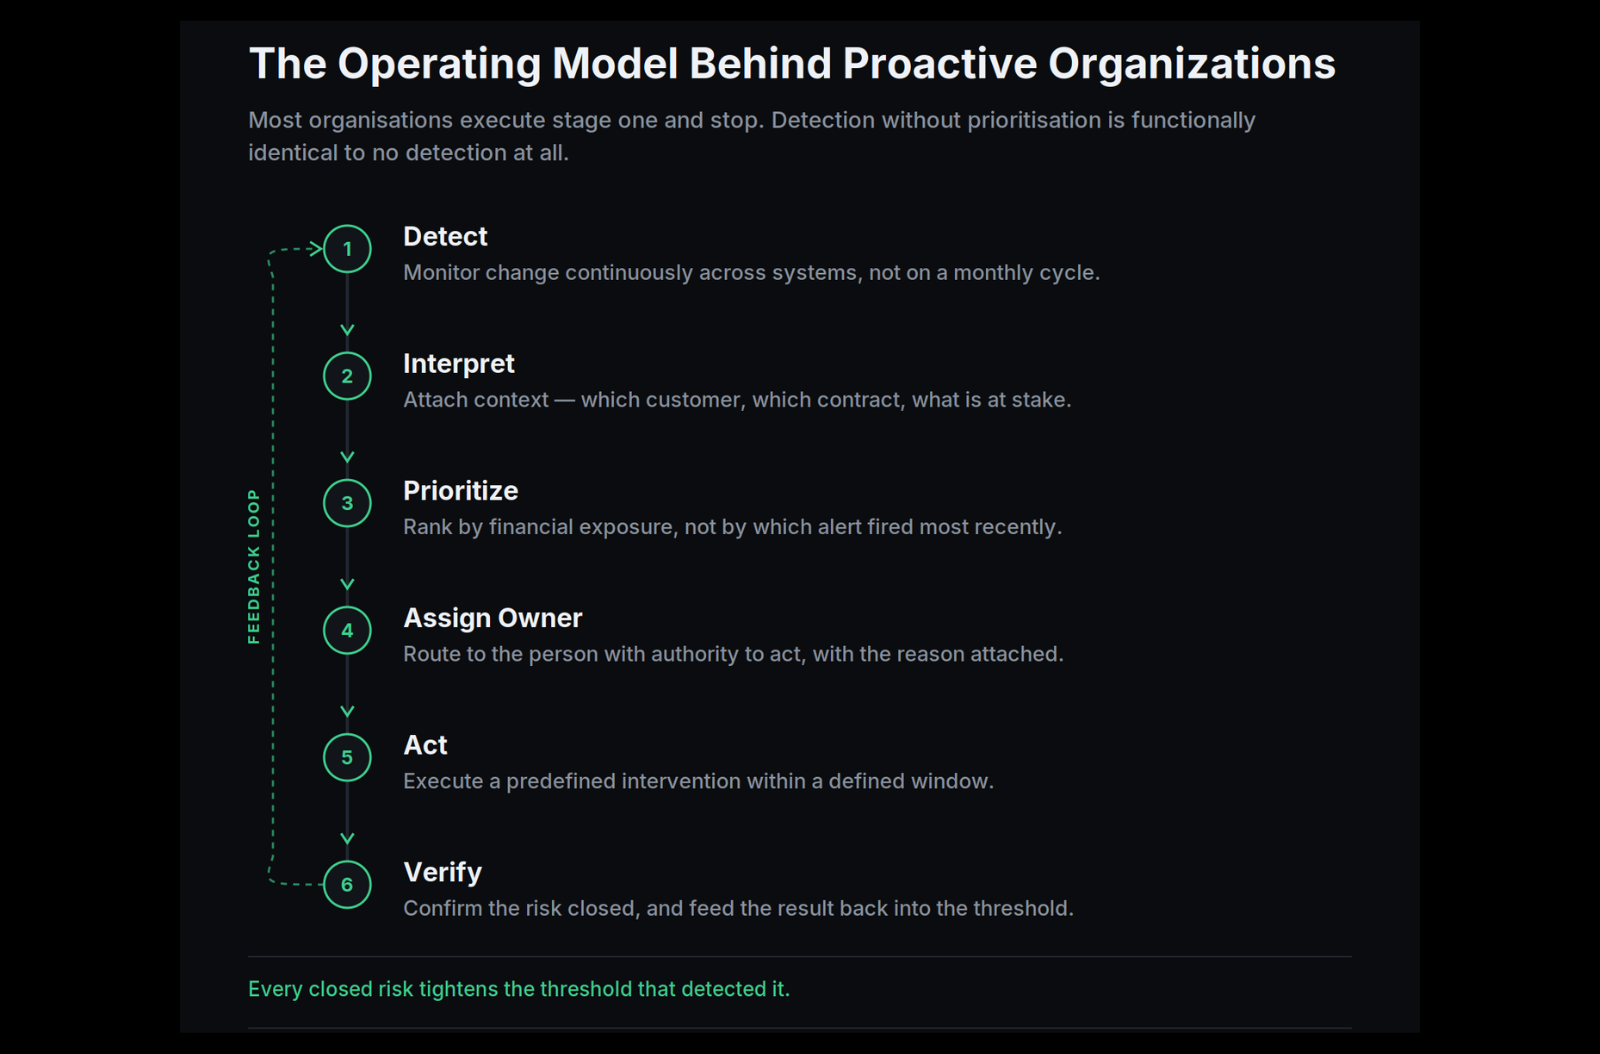
Most organisations execute Detect reasonably well and stop there. Detection without prioritisation produces alert fatigue, which is functionally identical to no detection at all.
How can a company move from reactive to proactive risk management?
The shift requires three changes. First, connect data across functions so customer, financial, supplier and operational signals can be evaluated together rather than in isolation. Second, define what constitutes a meaningful change for each critical signal, and tie thresholds to financial exposure so alerts rank by cost rather than recency. Third, assign a named owner and a defined action to every signal, so detection reliably becomes intervention.
Proactive risk management is not primarily a technology upgrade. It is a decision to monitor a small number of leading indicators seriously and act on them within a defined window.
In practice - Retail Rather than reviewing stockouts monthly, a chain monitors supplier acknowledgement delay against store-level demand velocity. When both move adversely for the same SKU, replenishment is rerouted before shelves empty - a decision made in hours, not in the following month's review.
How Lektik Helps Leadership Teams See Problems Earlier
The business problem. Leadership teams are not short of data. They are short of a single view in which customer, financial, supplier and operational change can be assessed together, early enough to matter.
Why traditional approaches fall short. Reporting projects improve the accuracy of what arrives late. Dashboard projects add another surface someone must remember to check. Neither shortens the distance between signal and action.
Where Lektik fits. Lektik connects operational, financial, customer and supplier data so meaningful change surfaces while it is still inexpensive to fix. That means helping leadership teams:
- Identify unusual patterns across systems that appear normal in isolation
- Detect high-risk accounts before renewal, not during it
- See supplier and delivery impact traced through to the customers and commitments it touches
- Prioritise exceptions by financial exposure rather than alert volume
- Understand downstream consequences - what a delay in one place causes three steps later
- Notify the right team with enough context to act immediately
Where IkyaData fits naturally. When the core challenge is understanding relationships - across customers, suppliers, contracts, locations and operations - IkyaData connects those sources and allows leaders to interrogate them directly. Not another report to read. A way to ask what is changing, and why, in plain language.
Executive Insight
Lektik helps leadership teams detect risks earlier, understand their business impact, and act before small problems become expensive ones.
Executive Takeaways
✓ Every expensive failure begins as a small, observable signal.
✓ Reports explain what happened. Connected data indicates what happens next.
✓ The warning signs usually already exist - fragmented across systems and teams.
✓ Fragmentation delays detection and the agreement required to act.
✓ Dashboards require someone to look. Early warning systems tell people when to act.
✓ Detection without prioritisation creates alert fatigue and changes nothing.
✓ Six meaningful signals outperform sixty disconnected metrics.
✓ Every signal needs a named owner and a defined action to become a real control.
Frequently Asked Questions
Q: What is an early warning system in business?
A: An early warning system continuously tracks leading indicators across customer, financial, supplier and operational data, and alerts a named owner when a meaningful change occurs. Unlike a report or dashboard, it is designed to trigger action within the window where a problem can still be prevented - before churn, stockouts, SLA breaches or margin loss are locked in.
Q: Why are business problems usually detected too late?
A: Because the evidence is fragmented and the reporting cycle is slow. Signals of a single failure typically sit in four or five systems owned by different teams, each seeing only a fragment that looks unremarkable alone. By the time monthly reporting aggregates the outcome, the decision window has closed.
Q: What are examples of early warning signals for customer churn?
A: Declining product or service usage, rising support escalations, longer response times from a key stakeholder, invoice disputes or slower payment, reduced participation in reviews, and lapsed renewal ownership. Individually these look minor. Combined - particularly usage decline alongside rising escalations - they reliably predict churn weeks or months before renewal.
Q: How is an early warning system different from a BI dashboard?
A: Business intelligence is retrospective and pull-based - it answers questions you already thought to ask, usually within one function. An early warning system is prospective and push-based: it monitors change across functions, prioritises by financial exposure, and routes alerts to the person who can act. BI explains performance. Early warning changes it.
Q: How do you detect supply chain risk early?
A: Track supplier behaviour, not only supplier outcomes. Lead-time drift, partial shipments, rising order acknowledgement times, quality rejection rates and communication delays typically precede a hard failure. The higher-value step is linking those signals to downstream exposure - which customers, contracts and commitments depend on that supplier - so severity ranks by business impact rather than supplier size.
Q: Can AI help detect business risks earlier?
A: Yes, in three main ways: connecting data across systems never designed to communicate, surfacing unusual patterns that fall outside predefined rules, and tracing relationships between customers, suppliers, contracts and operations to reveal downstream consequences. AI is most effective when applied to a defined set of business-critical signals - not deployed to monitor everything indiscriminately.
Q: What does proactive risk management cost compared with reacting late?
A: Reactive management pays twice - for the loss itself and for the emergency response: expedited freight, penalty credits, discounted retention offers, replacement acquisition cost, management time. Early intervention typically costs a conversation and a schedule change. The ratio varies by business, but the pattern holds: intervention cost stays roughly flat, while the cost of the problem compounds.
Q: How many signals should a leadership team actively monitor?
A: Fewer than most expect. Six to twelve high-exposure signals with defined thresholds and named owners will outperform a large catalogue of loosely tracked metrics.
See Problems While They Are Still Small
Lektik connects the data you already have - operational, financial, customer and supplier - so risks surface while intervention still costs a conversation.
Talk to the Lektik team →| Explore IkyaData →